Dead Days: The Interest Hiding in Your Draw Cycle
A $100,000 draw that funds two days sooner earns the lender about $33 more in interest at a 6% note rate. Nobody calls a meeting about $33, which is exactly why this money goes missing.
Construction lenders track inspection fees to the dollar, along with exceptions, extensions and days past due. The days between a complete draw request and funding get measured in patience instead, even though on loans that accrue interest on the disbursed balance, a draw only starts earning once it funds.
We call them dead days: calendar days a draw spends waiting to be ordered, scheduled, delivered or reviewed rather than being worked. This guide shows where they come from, what they're worth at your size and how to find yours, with a calculator and a one-page PDF report you can take to your team.
One $100,000 draw, funded 2 days sooner at a 6% note rate
2 days sooner on $50M of draws funded in a year (gross, at 6%)
2 days sooner on $300M of draws funded in a year (gross, at 6%)
Why nobody books it
Dead days are an opportunity cost, and accounting systems don't record opportunities. An inspection fee is a line item. Two extra days of waiting show up nowhere: the draw still funds, interest still accrues from the funding date, and every report looks the way it would have anyway. They aren't an expense; they're income that never started.
Per draw, it's pocket change, and nobody escalates $32.88. A construction book, though, funds hundreds or thousands of draws a year, and the wait repeats on every one. If you've ever negotiated a few dollars off an inspection fee, consider that three extra days on a $100,000 draw at 6% cost about $49 in gross interest. The fee is visible. The float isn't.
The math, in one line
Added interest income = draw dollars × note rate × calendar days saved ÷ 365. For one draw, use the draw amount. For your book, use the draw dollars you fund in a year. For a net figure, subtract what idle funds earn from the note rate.
Every step of a draw
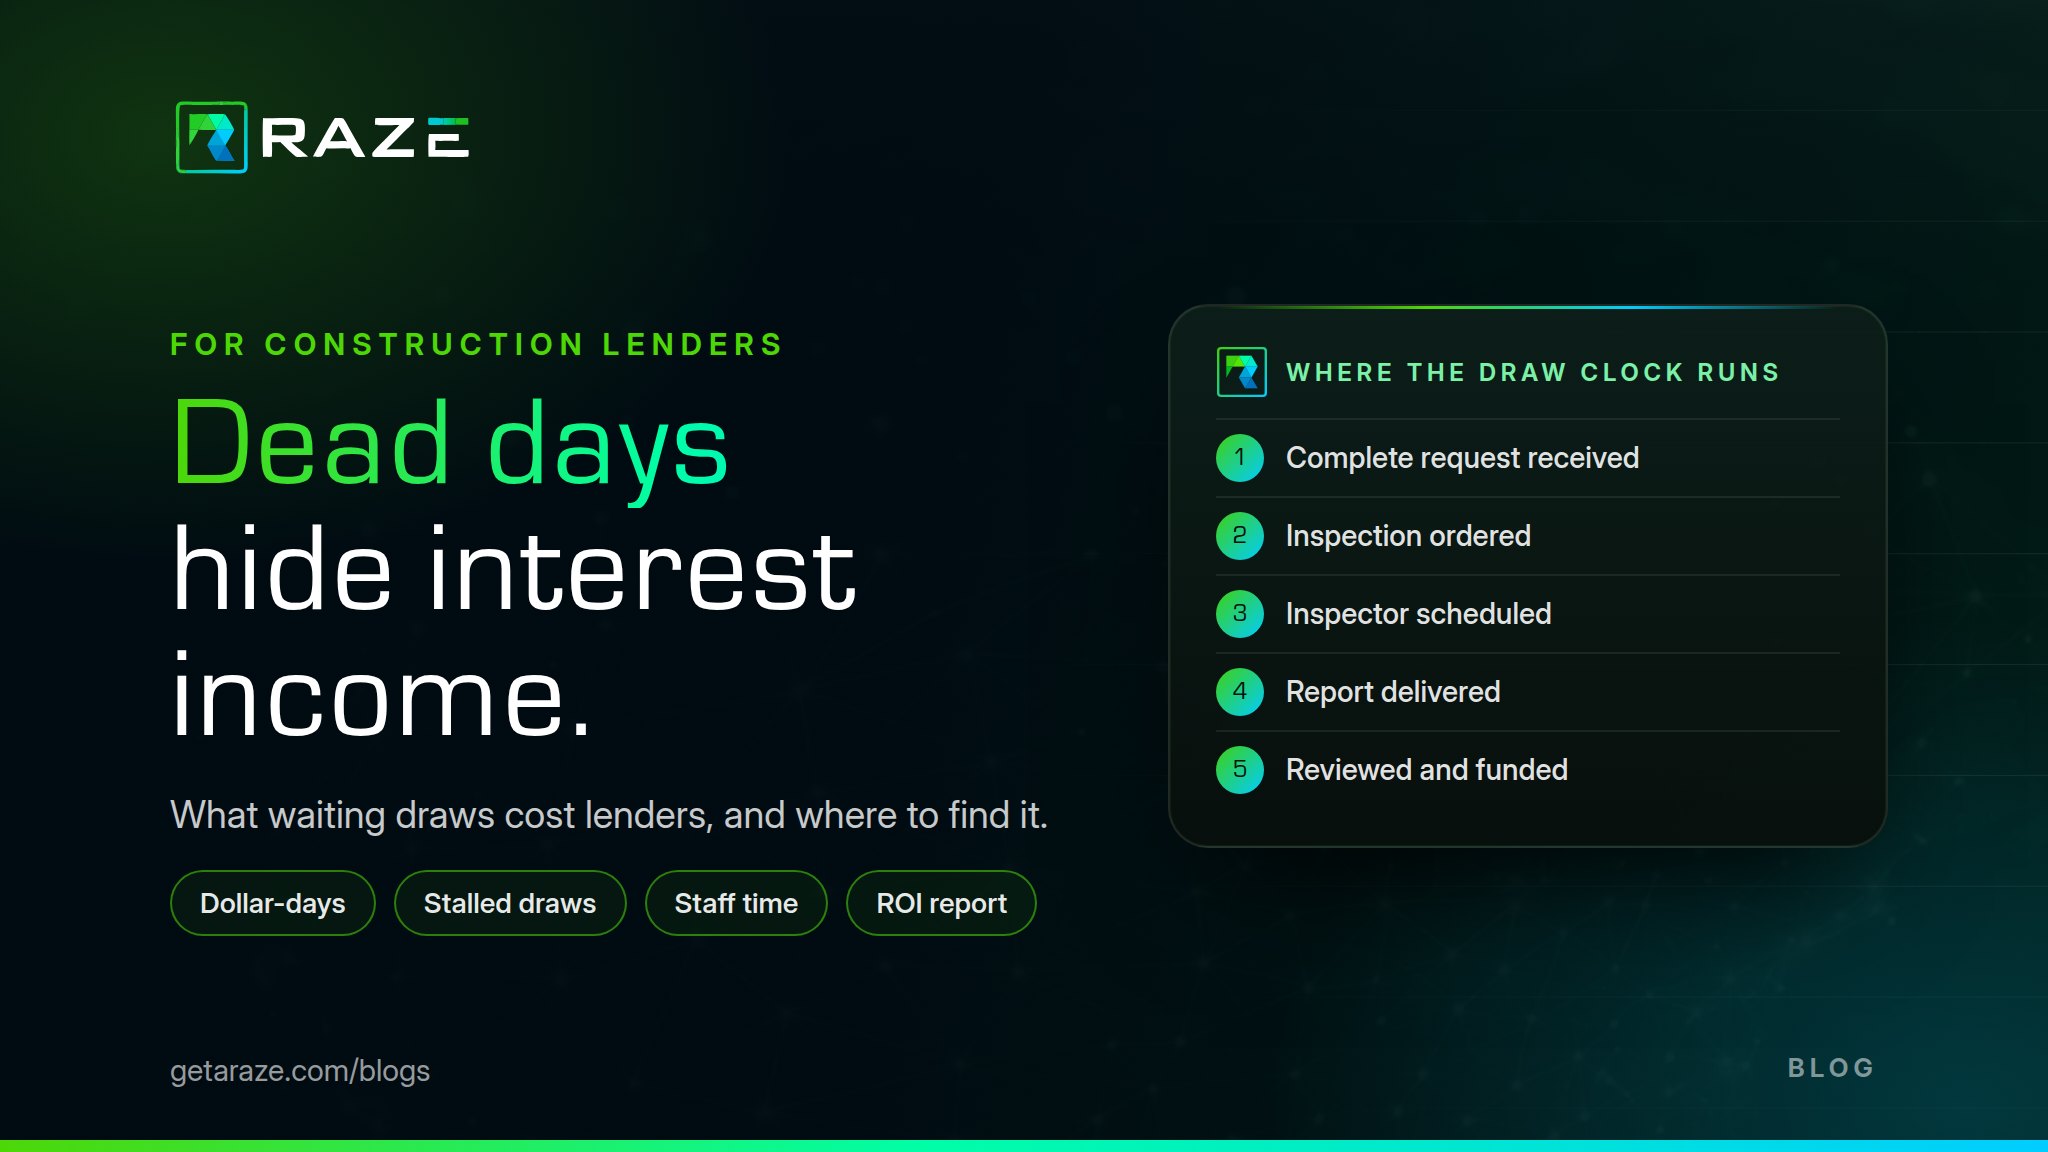
From the GC's request to funds released, a draw passes through several hands. The site visit is the only step that needs someone on the job, and it takes hours. The rest are handoffs, and handoffs are where dead days pile up. Switch to the full process to see the steps larger programs add.
- Borrower & GC
- Lender
- Inspector
- Title & fund control
GC requests the draw
Borrower & GCThe general contractor submits a pay application for work in place: budget line items, percent complete and invoices.
Complete request received
LenderEvery document the lender requires is in. Define "complete" once and measure from it every time.
Dead-day risk: Missing documents send it backThe clock startsLender orders the inspection
LenderThe order goes to an inspector or an inspection network.
Dead-day risk: Sits in an inbox until someone orders it by handInspector scheduled
InspectorAn inspector in the property's market takes the order and confirms access with the borrower or GC.
Dead-day risk: Finding coverage, then chasing a confirmationInspector on site
InspectorThe inspector records percent complete by line item, with photos and notes on the work in place.
The work: hours, not daysReport submitted
InspectorThe report goes back to the lender with its photos and line items.
Dead-day risk: A late report, or one missing photos or line itemsLender reviews the report
LenderThe reviewer reconciles the report against the request, line by line.
Dead-day risk: Questions bounce between lender, inspector and borrowerDraw approved
LenderThe lender approves the amount line by line, less any retainage held until completion.
Funds released
LenderThe money goes out by wire or ACH. Interest on this draw accrues from this date.
Interest starts
The same draw, two speeds
Here is one illustrative cycle, stage by stage, with the waiting shaded amber. Speed up the inspection side (ordering, scheduling and the report) and the dead days shrink, while the site visit, review and funding stay as they are. Pick a book size to see what those days are worth.
Typical cycle
7 days
Faster inspection side
4 days
- Order the inspection1 → 0 days
- Schedule the inspector2 → 1 day
- Site visit1 → 1 day
- Report delivered1 → 0 days
- Review and approval1 → 1 day
- Funding1 → 1 day
Draw dollars funded per year
- Dead days removed
- 3 days
- 7 days → 4 days
- On one average draw
- +$23.62
- $47,893 draw at 6%
- A year of draws
- +$24,658
- $50M funded at 6%, gross
Measure dollar-days, not days
The instinct is to track draw speed as an average: request to funding, in days. For dead days, an average is the wrong tool, for two reasons.
The days aren't spread evenly. An average of five days can mean every draw takes five days, or that eight take three days and two take thirteen. Those are different problems with different fixes.
Not every day costs the same. A day of delay on a $200,000 draw costs ten times what it costs on a $20,000 draw.
The unit that captures both is the dollar-day: the draw amount multiplied by the days it waited. Add them up across your book, multiply by your note rate and divide by 365, and you have the gross interest those waiting days cost you. Here are two illustrative books of ten equal-size draws with the same five-day average:
| Illustrative book, 10 equal-size draws | Book A: even | Book B: stalled tail |
|---|---|---|
| Typical draw | Book A: even5 days | Book B: stalled tail3 days |
| Stalled draws | Book A: evenNone | Book B: stalled tail2 draws at 13 days |
| Average, request to funding | Book A: even5.0 days | Book B: stalled tail5.0 days |
| Share of all waiting days in the slowest 2 draws | Book A: even20% | Book B: stalled tail52% |
| Fastest route to a 2-day improvement | Book A: evenSpeed up all 10 draws | Book B: stalled tailUnstick 2 draws |
Book B is where the money is easiest to find: fix two draws and the average drops two days, the same result as shaving two days off every draw in Book A. If the stalled draws are also large ones, their share of the dollar-days grows further. Your average can look fine while a handful of high-dollar draws carry most of the cost.
What dead days are worth at your size
Added interest income per year at a 6% note rate, by the draw dollars you fund in a year:
| Draw dollars funded per year | 2 days saved | 5 days saved |
|---|---|---|
| $5M | 2 days saved$1,644 | 5 days saved$4,110 |
| $10M | 2 days saved$3,288 | 5 days saved$8,219 |
| $20M | 2 days saved$6,575 | 5 days saved$16,438 |
| $35M | 2 days saved$11,507 | 5 days saved$28,767 |
| $50M | 2 days saved$16,438 | 5 days saved$41,096 |
| $85M | 2 days saved$27,945 | 5 days saved$69,863 |
| $150M | 2 days saved$49,315 | 5 days saved$123,288 |
| $300M | 2 days saved$98,630 | 5 days saved$246,575 |
These are gross figures at a 6.0% average note rate, assuming the full volume funds through draws within the year, the same assumption as the calculator's book sizes. What your idle funds earn, your pricing and your draw mix will move them, which is why the calculator below uses your numbers instead of ours.
The second line item: people
Dead days also cost coordination: the status email, the call to the inspector, the borrower asking where the money is, the reviewer chasing a missing photo.
Price it plainly, because it's the easier number to overstate. At $65,000 fully loaded (about $31.25 an hour), 20 minutes saved on each of 100 draws a month returns 400 hours a year, worth $12,500. The 20 minutes is an illustrative assumption, not a measured RAZE result, so use your own. Recovered time isn't cash until you use it: absorbing more loans without adding headcount, or moving people to higher-value work.
Run your own numbers
Draw Cycle ROI Calculator
What is a faster draw cycle worth?
Pick a portfolio size or enter your own draws, rate, and staff costs. Move the days-saved slider, or tap a bar, to see how added interest income scales. Then download a one-page PDF report with your numbers and the math behind them.
Start from a residential portfolio size, then make it yours
Illustrative presets: one draw per loan per month, with the full volume funded through draws each year and nothing funded at closing. Your own draw count and average draw give a better estimate.
Your draws
= $50,000,000 funded through 1,044 draws a year
Your assumption, not a RAZE result. Count only days where the inspection is what holds up funding.
What undisbursed cash earns while a draw waits, such as your overnight rate. If you borrow to fund draws, use that borrowing rate. Leave at 0 for gross interest.
Your staff costs
Salary plus benefits and payroll taxes. Staff count only caps the hours that can be freed.
Minutes saved per drawIllustrative estimate20 min▾
An illustrative assumption for the coordination work a standardized inspection workflow can remove. It is not based on measured RAZE results, so replace it with your own.
After borrower-paid fees and any inspection spend it replaces. Adds ROI, payback, and break-even.
Estimated annual value
$27,313
$16,438 added interest income (gross) + $10,875 value of staff time freed (non-cash capacity)
Added interest income (gross)
$16,438
Per year. Each day saved adds $8,219.
Staff hours freed
348 hrs
Worth $10,875 a year at $31.25/hr, about 0.2 FTE of capacity.
Added interest income, by calendar days saved
2 days: $16,438
| Days saved | Added interest per year |
|---|---|
| 1 | $8,219 |
| 2 | $16,438 |
| 3 | $24,658 |
| 4 | $32,877 |
| 5 | $41,096 |
| 6 | $49,315 |
| 7 | $57,534 |
| 8 | $65,753 |
| 9 | $73,973 |
| 10 | $82,192 |
Get these results as a PDF report
A one-page summary with your inputs, the math, and the assumptions, ready to share with your team.
Illustrative estimate, not a guarantee or a measured RAZE result. Added interest income = annual draw dollars × (note rate − yield on idle funds) × calendar days saved ÷ 365, for loans that accrue interest on disbursed balances and whose payoff dates don't change; with no yield entered, it is gross. Days saved is your assumption. Staff time value = annual draws × minutes saved per draw ÷ 60 × (cost per staff member ÷ 2,080 paid hours), capped at your staff's total hours; it is non-cash capacity. Minutes saved per draw start from an illustrative assumption, not measured RAZE results, so replace them with your own. ROI includes staff time value; the interest-only ROI is the cash view.
The float is the floor
Everything above is the part you can calculate, and it may not be the biggest part. Builders notice how fast they get paid. Faster, more predictable funding can help a builder keep crews on site and pay subs on time, which is a reason to bring the next project back to the same lender. Slow funding is a reason to take other lenders' calls.
A simple way to frame it: if faster, more predictable funding wins you one additional $400,000 build a year, that loan alone earns roughly $12,000 in interest at 6%, assuming it averages half-drawn over a 12-month build, before any origination fee. On a small book, one retained builder can be worth more than a full year of recovered float. The float is the floor, not the ceiling.
What the math doesn't say
It's gross, not net
Undisbursed funds earn something while they wait, so the true gain is the note rate minus that yield. Enter it in the calculator for the net figure.
It only counts days the inspection holds up funding
Title, lien waivers, approvals, and fixed funding days aren't touched by a faster inspection. Borrowers pay the added interest, and they get their money sooner.
It assumes interest accrues on disbursed balances
If you charge interest on the full commitment from closing, draw speed doesn't change your interest income. The staff time and builder math still applies.
It assumes the payoff date doesn't move
If faster funding also finishes the build and pays the loan off sooner, that loan earns less total interest. The benefit shows up as capital freed for the next loan instead.
Speed can't come from skipping verification
The goal is removing wait time, not inspection standards. A faster draw on a bad report is just a faster loss.
Measure before you claim
The only days-saved number that matters is the one you can see in your own request-to-funding history.
How to find your dead days
Pull 12 months of draws
For each draw, capture the amount and five dates: complete request received, inspection ordered, inspection completed, report received, and funded.
Time every draw
Count the days from complete request to funding for every draw. Sort slowest to fastest and look hard at the top 10%.
Rank by dollar-days
Multiply each draw's amount by the days it waited, then re-sort. The draws at the top of this list are where your interest income is going.
Tag the cause
For each slow draw, note where the clock stalled: ordering, scheduling, report quality, or review. Patterns show up fast.
Put a number on it
Total dollar-days × note rate ÷ 365 is the most the waiting cost you last year, in gross interest. Only the inspection-driven part is addressable by faster inspections, so use the causes you tagged. Then run those days through the calculator above.
Frequently asked questions
Keep reading
How much does a draw inspection cost?
The typical U.S. range, and every RAZE rate on one card.
Vet your draw inspection company
Seven questions to ask before your next order, with RAZE's answers.
Compare draw inspection software
Our 2026 pick and the alternatives, by the problem each one solves.
Draw inspection process FAQs
From the order to funding release, the questions lenders ask.
Construction lending glossary
Draws, retainage, percent complete, and the rest of the vocabulary.
Find out where your draw clock stalls
See how a standardized inspection workflow takes wait time out of the draw cycle, from order to delivered report, without changing your inspection standards.
The clock stops. Interest starts.
Find the dead days in your draw cycle
Request a demo